
Top 7 Benefits of AIOps for Modern Infrastructure Monitoring
Discover the top 7 benefits of AIOps, from reducing MTTR to improving compliance, scalability, and cost efficiency in modern IT infrastructure monitoring.
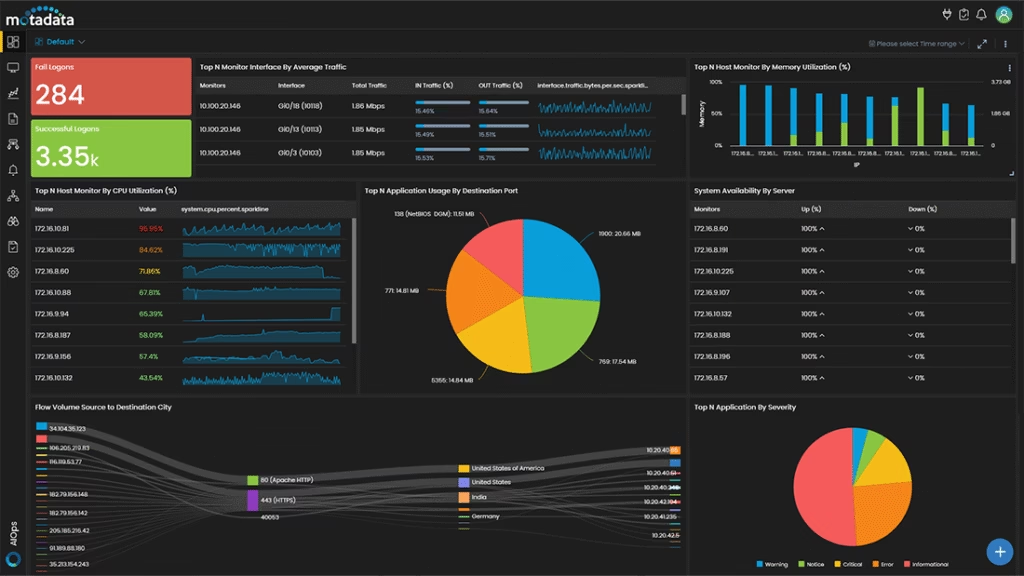
Modern networks span cloud, on-premise, and hybrid environments. Keeping them secure, efficient, and resilient is harder than ever. Motadata network monitoring software gives you complete visibility, detects anomalies in real time, and helps you resolve issues before they disrupt services.

Today’s organisations rely on digital infrastructure for every operation. Yet:
Our solution uses AIOps-powered analytics to break down silos, capture metrics, and deliver insights across every layer of your network.
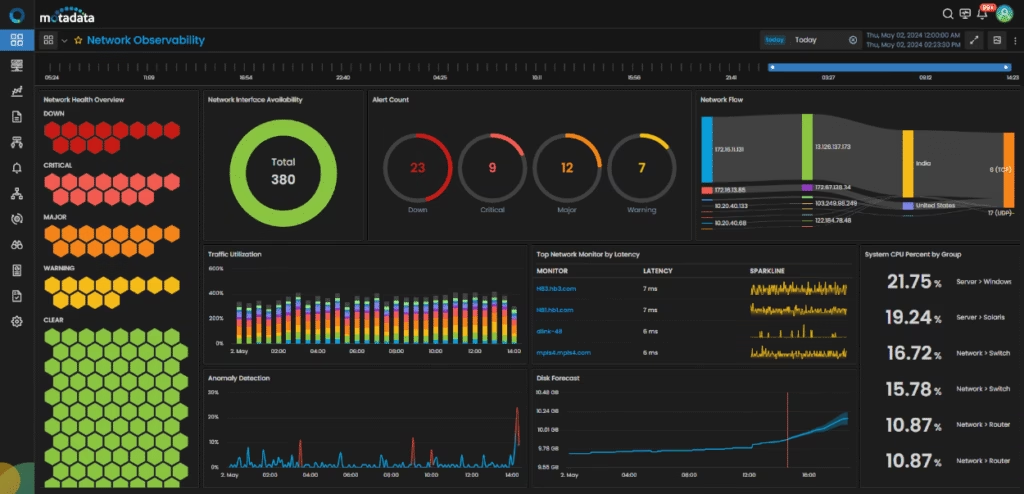
Break down data silos. Achieve end-to-end visibility of your network’s performance, SNMP data, network flow, and logs. Effectively monitor and analyse your entire network, from on-premise to the cloud.
Motadata network monitoring software helps you capture and analyse the massive amount of streaming traffic data from your multi-cloud or hybrid infrastructure. This helps you quickly identify anomalies that could impact your business goals.
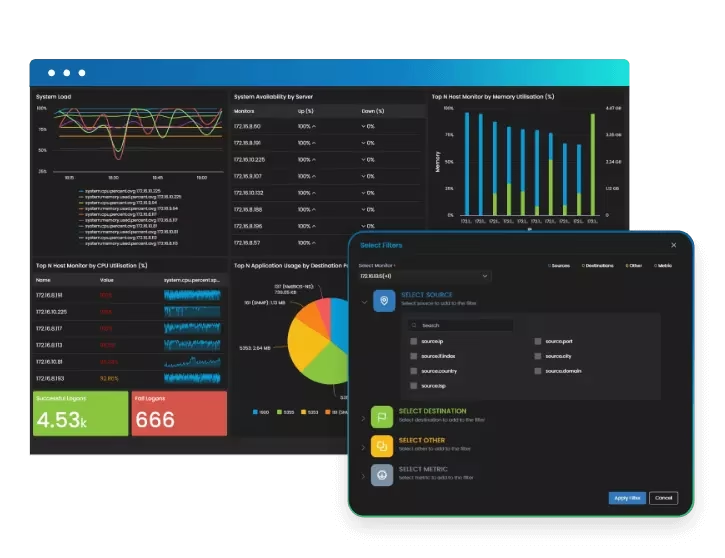
Motadata unified Network Monitoring Software offers scalable observability and analytics. It is powered by machine learning and covers your entire hybrid infrastructure, including network devices, virtualisation, applications, and cloud.
Our AI-driven engine gathers data, correlates it, and maps dependencies. This helps you understand why specific events have occurred.
Efficiency is everything in IT. The right Network Monitoring Software saves you time, money, and headaches. Here are some critical features to look for when choosing a solution:
Our proactive approach helps you find and fix bottlenecks before they disrupt operations.
Go beyond basic monitoring. Our AI analyses vast amounts of data to find hidden patterns and automate routine tasks.
Your network is always changing. Our scalable tool handles growth in size and complexity without a loss of performance. It monitors a diverse range of devices and technologies.
Your monitoring system should not be a silo. Our software integrates with existing tools to provide a unified view of your entire network.
Our strong security features help you protect sensitive data and meet industry regulations.
Motadata Network Monitoring Software offers the following features, out-of-the-box:
Visualise your entire network with automatic device discovery. Our AIOps platform maps all connected devices, giving you a clear understanding of your network layout.
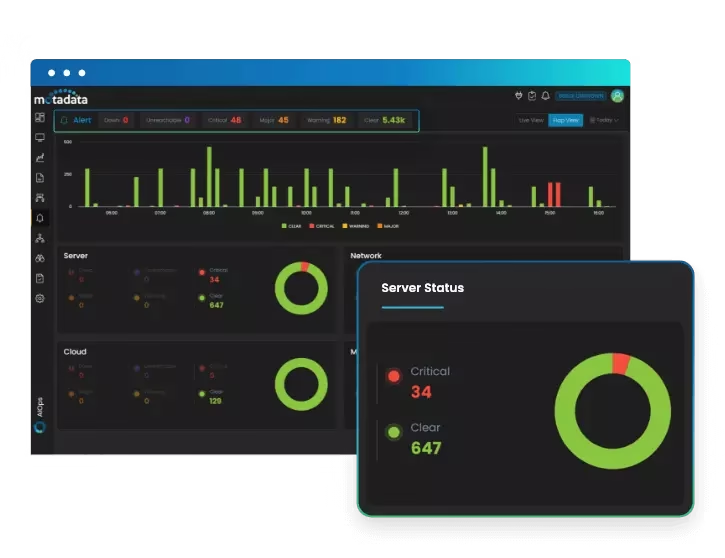
Get notified of any network disruption instantly. You can choose to receive alerts via email, SMS, or push notification.
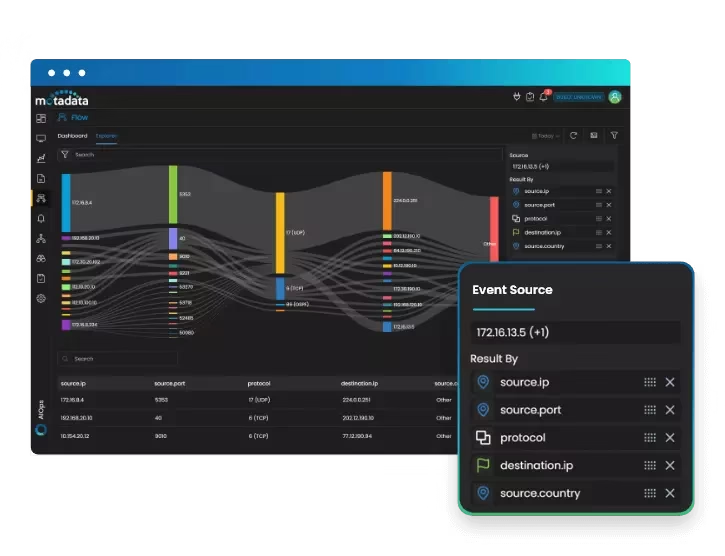
Go beyond basic bandwidth monitoring. Gain deep insights into traffic patterns, application usage, and user behaviour.
Track key performance metrics like latency and packet loss in real time. This helps you proactively address issues.
Ensure the health and stability of your VPN connections. Proactively monitor IPsec and SSL to safeguard your network.
Get granular insights by exploring historical data. This empowers you to make informed decisions for network optimisation.
Monitor the health of critical network services. Receive instant notifications if a service experiences an outage.
Take Syslog monitoring to the next level. Our dynamic parsers categorise logs, allowing you to quickly pinpoint specific events and gain valuable insights.
Our AI identifies unusual network behaviour. It integrates with your ITSM tool to automatically create incident tickets for detected anomalies, streamlining your workflow.
Use AI and machine learning to quickly pinpoint the root cause of network issues. By integrating with your NCM tool, our platform correlates events with configuration changes, leading to faster problem resolution.
Gain insights into wireless network health and troubleshoot connectivity issues.
Analyse logs to get valuable security insights and identify suspicious activity.
Monitor switch performance and manage configurations from a central console.
Use the industry-standard SNMP to collect data from a wide range of devices.
While many Network Monitoring Software options exist, our solution provides a unique advantage. Its combination of AI-powered intelligence, unmatched scalability, and a unified monitoring experience sets it apart. Explore our Network Observer to see how it uses cutting-edge technologies to be a smart, advanced tool in the market.
Simplify IT. Improve Security. Power Growth.
Harness the key principles of service management beyond IT and drive productivity across the entire organisation.
Are you embracing digital innovations to its fullest potential? Why not connect and discuss how we can help propel your business into the next era of efficiency, agility, and success.
Optimal asset management is essential for operational excellence in today’s competitive landscape. Our solutions provide a comprehensive framework that strategically oversees assets, ensuring reliability and maximising ROI.
Discover the top 7 benefits of AIOps, from reducing MTTR to improving compliance, scalability, and cost efficiency in modern IT infrastructure monitoring.

Learn what AIOps is and how AI-powered IT operations transform monitoring, incident management, and automation in modern IT environments.

Discover how Enterprise Service Management helps SMEs cut costs, boost efficiency, and overcome growth barriers. Free up time and headspace to scale smarter.
Step into the future of IT Service Management.
Connect with us today to discover how our ITSM solutions can elevate your IT operations and pave the way for success in the digital landscape.
Break free from tool sprawl with unified observability. ManageEngine OpManager relies on a collection of separate tools, such as Application Manager and Event Manager, to provide a full picture. In contrast, our platform, Motadata AIOps, is purpose-built as a single solution for complete observability, integrating metrics, logs, traffic, and traces into one seamless view.
Unlock more features with a single, clear pricing model. IT teams are moving to Motadata AIOps to consolidate their monitoring. Our platform’s ability to effortlessly process billions of metrics and terabytes of log data makes it a premier observability solution. This superior scalability and comprehensive feature set, without the added cost of multiple paywalls, is why many IT teams have chosen to switch from ManageEngine to Motadata.
| Functionality | Motadata AIOps | ManageEngine OpManager Plus |
|---|---|---|
| Metrics Explorer | Yes | No |
| Baseline Threshold | Yes | Yes |
| Anomaly Detection | Yes | No |
| Identify Outliers | Yes | No |
| Topology | Yes | Yes |
| Runbook | Yes | Yes |
| Support for Custom Runbook Plugin with Go and Python language | Yes | No |
| Functionality | Motadata AIOps | ManageEngine OpManager Plus |
|---|---|---|
| Ping Check | Yes | Yes |
| TCP Based Status Polling | Yes | Yes |
| Schedule downtime | Yes | Yes |
| Service Level Management Dashboards | Yes | Yes |
| Support for adding custom device types | Yes | Yes |
| Real-time Perf. and Traffic Monitoring via SNMP | Yes | Yes |
| Functionality | Motadata AIOps | ManageEngine OpManager Plus |
|---|---|---|
| Monitoring CPU, Memory and Disk Utilization & other performance metrics | Yes | Yes |
| Service Monitoring | Yes | Yes |
| Windows Service Monitoring | Yes | Yes |
| Process Monitoring | Yes | Yes |
| Hardware health monitoring | Yes | Yes |
| File/ Folder monitoring | Yes | Yes |
| VMware Monitoring | Yes | Yes |
| Xen Server Monitoring | Yes | Yes |
| Nutanix Monitoring | Yes | Yes |
| Cisco UCS Monitoring | Yes | Yes |
| Hyper-V Monitoring | Yes | Yes |
| Virtual Machine monitoring | Yes | Yes |
| Cloud Infrastructure Monitoring | Yes (AWS, Azure and M365) | Requires separate Product |
| Wireless Monitoring | Yes | Yes |
| System Health Monitoring | Yes | Yes |
| Script Monitoring | Yes | Yes |
| URL Monitoring (With content check) | Yes | Yes |
| Custom SNMP monitoring | Yes | Yes |
| CLI Based Perf. Monitoring | Yes | Yes |
| Application Monitoring | Yes | Yes, via APM Plug-in |
| Functionality | Motadata AIOps | ManageEngine OpManager Plus |
|---|---|---|
| Interfaces Monitoring for traffic, errors & discards | Yes | Yes |
| CPU And Memory Utilization for Routers | Yes | Yes |
| Rediscover option for finding the interfaces newly added, deleted, modified etc. | Yes | Yes |
| Cisco IP SLA based WAN RTT Monitoring | Yes | Yes |
| Functionality | Motadata AIOps | ManageEngine OpManager Plus |
|---|---|---|
| Network Configuration Management | Yes | Requires NCM add-on |
| Auto NCM Discovery from Monitor discovery | Yes | No |
| Device Template | Yes | Yes |
| Runbook Automation | Yes | Yes |
| Schedule automatic configuration backups | Yes | Yes |
| Push and revert configurations across multiple devices | Yes | Yes |
| Monitor configuration changes & receive alerts | Yes | Yes |
| Routine check on compliance for network devices | Yes | Yes |
| Functionality | Motadata AIOps | ManageEngine OpManager Plus |
|---|---|---|
| Log Management support in single console | Yes | Requires separate product |
| Dynamic Log Parser | Yes | No |
| Live Log Tail | Yes | No |
| Surrounding Logs | Yes | No |
| Log Explorer and Analytics | Yes | Yes |
| Log Pattern Identification | Yes | No |
| Log Anomaly Detection | Yes | No |
| Functionality | Motadata AIOps | ManageEngine OpManager Plus |
|---|---|---|
| Support for Flow in single console | Yes | Requires separate Product |
| Supported Flow Protocols | NetFlow, sFlow, jFlow, NBar2 | Yes |
| Automatic Flow data capture | Yes | Yes |
| Flow Anomaly Detection | Yes | No |
| Functionality | Motadata AIOps | ManageEngine OpManager Plus |
|---|---|---|
| API based integration with the existing IT management ecosystem | Yes | Yes using REST API |
| Help Desk Integration | Yes | Yes |
| Failover – Hot standby engine | Yes | Yes |
| 24×5 email and phone support | Yes | Yes |
Tired of juggling multiple monitoring tools? Conduct your IT orchestra with a unified AI symphony from Motadata. Our platform helps you predict issues, optimise performance, and conquer the complexity of hybrid environments. You can ditch the fragmented toolbox and master your IT with Motadata.
Unlock more features with a single, clear pricing model. IT teams are consolidating their monitoring tools and moving to Motadata AIOps. Our platform is one of the top observability solutions, with the ability to scale and process billions of metrics and terabytes of log data. This superior scalability and comprehensive feature set, without the hidden costs of multiple paywalls, is why many IT teams have chosen to switch from SolarWinds to Motadata.
| Functionality | Motadata AIOps | SolarWinds NPM |
|---|---|---|
| Database | Proprietary Database | MS SQL |
| OS | Linux | Windows |
| Min. Polling Interval | 1 Sec with Agent | 10 Sec. |
| High Availability | Yes | Yes |
| Agent | Agent-Based and Agent less Monitoring | Agent-Based and Agent less Monitoring |
| Functionality | Motadata AIOps | SolarWinds NPM |
|---|---|---|
| SNMP v1 to v3 | Yes | Yes |
| CLI | Yes | Yes |
| SSH & Telnet | Yes | Yes |
| HTTP/HTTPS | Yes | Yes |
| ICMP | Yes | Yes |
| Functionality | Motadata AIOps | Solarwinds NPM |
|---|---|---|
| Metrics Explorer | Yes | No |
| Baseline Threshold | Yes | No, Supported in SAM |
| Anomaly Detection | Yes | No, Available in Database Performance Analyser |
| Forecasting | Yes | No |
| Identify Outliers | Yes | No, Available in Database Performance Analyser |
| Capacity Planning | Yes, servers, virtualisation, cloud services, network device. | No, Only supported in storage Monitoring |
| Topology | Yes | Yes |
| Runbook | Yes | Yes |
| Support for Custom Runbook Plugin with Go and Python language | Yes | Yes |
| Root Cause Analysis | Yes | No, requires separate product |
| Metrics Correlation | Yes | Yes |
| Functionality | Motadata AIOps | Solarwinds NPM |
|---|---|---|
| Network Device Discovery via SNMP, ICMP & CIDR | Yes | Yes |
| Automatic Server Services discovery | Yes | Yes |
| Scheduled Discovery | Yes | Yes |
| Layer2 Discovery | Yes | Yes |
| VLAN Discovery | Yes | Yes |
| Agent for monitoring devices | Yes | Yes |
| Automatic addition of NetFlow/Syslog devices | Yes | Yes |
| Automatic Layer 2/ Layer 3 Network Maps | Yes | No |
| Support for Custom Runbook Plugin with Go and Python language | Yes | Yes |
| Category-based Infrastructure Views | Yes | Yes |
| Custom Infrastructure View | Yes | No |
| Business Views for custom grouping of devices | Yes | Yes |
| Network Traffic Maps | Yes | Yes |
| Functionality | Motadata AIOps | Solarwinds NPM |
|---|---|---|
| Ping Check | Yes | Yes |
| TCP Based Status Polling | No | Yes |
| Schedule downtime | Yes | Yes |
| Service Level Management Dashboards | Yes | Yes |
| Support for adding custom device types | Yes | Yes |
| Real-time Perf. and Traffic Monitoring via SNMP | Yes | Yes |
| Functionality | Motadata AIOps | Solarwinds NPM |
|---|---|---|
| Monitoring CPU, Memory and Disk Utilization & other performance metrics | Yes | Yes |
| Service Monitoring | Yes | Yes |
| Windows Service Monitoring | Yes | Yes |
| Process Monitoring | Yes | Yes |
| Hardware health monitoring | Yes | Yes |
| File/ Folder monitoring | Yes | No, but can be done via SAM |
| VMware Monitoring | Yes | Yes |
| Xen Server Monitoring | Yes | No |
| Nutanix Monitoring | Yes | Requires separate product |
| Cisco UCS Monitoring | Yes | Yes |
| Hyper-V Monitoring | Yes | Requires separate product |
| Virtual Machine monitoring | Yes | Yes |
| Cloud Infrastructure Monitoring | Yes (AWS, Azure and M365) | Requires separate product- Hybrid Cloud Monitoring |
| Wireless Monitoring | Yes (Cisco, Ruckus, Aruba) | Ruckus not supported |
| System Health Monitoring | Yes | Yes |
| Script Monitoring | Yes | No |
| URL Monitoring | Yes | No |
| Custom SNMP monitoring | Yes | Yes |
| CLI Based Perf. Monitoring | Yes | Yes |
| Application Monitoring | Yes | Requires SAM |
| Functionality | Motadata AIOps | Solarwinds NPM |
|---|---|---|
| Interfaces Monitoring for traffic, errors & discards | Yes | Yes, via SNMP & flow monitoring |
| CPU And Memory Utilization for Routers | Yes | Yes |
| Rediscover option for finding the interfaces newly added, deleted, modified etc. | Yes | Yes |
| Cisco IP SLA based WAN RTT Monitoring | No | Requires IPSLA Monitor Product. |
| Hop-wise WAN link visibility | No | Yes |
| Functionality | Motadata AIOps | Solarwinds NPM |
|---|---|---|
| Network Configuration Management | Yes | Requires NCM add-on |
| Auto NCM Discovery from Monitor discovery | Yes | No |
| Device Template | Yes | Yes |
| Runbook Automation | Yes | Yes |
| Schedule automatic configuration backups | Yes | Yes |
| Push and revert configurations across multiple devices | Yes | Yes |
| Monitor configuration changes & receive alerts | Yes | Yes |
| Routine check on compliance for network devices | Yes | Yes |
| Functionality | Motadata AIOps | Solarwinds NPM |
|---|---|---|
| Log Management support in single console | Yes | Requires separate product |
| Log Management for Windows, Linux, Application and Firewall Logs | Yes | Yes |
| Dynamic Log Parser | Yes | No |
| Live Log Tail | Yes | No |
| Surrounding Logs | Yes | No |
| Log Explorer and Analytics | Yes | Yes |
| Log Pattern Identification | Yes | No |
| Log Anomaly Detection | Yes | No |
| Functionality | Motadata AIOps | Solarwinds NPM |
|---|---|---|
| Support for Flow in single console | Yes | Requires separate Product |
| Supported Flow Protocols | NetFlow, sFlow, jFlow, NBar2 | Yes |
| Automatic Flow data capture | Yes | Yes |
| Flow Anomaly Detection | Yes | No |
| Functionality | Motadata AIOps | Solarwinds NPM |
|---|---|---|
| Monitoring of UPS load and Battery Status | Yes | No |
| Monitoring of input/output voltage and current | Yes | No |
| Printer Monitoring | Yes | Yes |
| Functionality | Motadata AIOps | Solarwinds NPM |
|---|---|---|
| Highly customisable dashboards | Yes | Yes |
| CCTV or Plasma View | Yes | No |
| Event-Alarm Correlation | Yes | Yes |
| Color Coded Alarms | Yes | Yes |
| SNMP Trap Processing and Forwarding | Yes | Yes |
| SMS/Email based alerts | Yes | Yes |
| Web Alarms | Yes | No |
| Acknowledge Alarms | Yes | Yes |
| Runbook execution on the event of an Alert | Yes | Yes |
| Syslogs Monitoring | Yes | Yes |
| Alerts based on Windows Event Logs | Yes | Yes |
| Alarm Escalation | No | Yes |
| Alarm Suppression | Yes | Yes |
| Functionality | Motadata AIOps | Solarwinds NPM |
|---|---|---|
| SLA Dashboards for Servers, Routers, Switches etc. | Yes | No |
| Server Availability/Outage Report | Yes | Yes |
| All Servers Availability Report | Yes | Yes |
| Discovery Reports | Yes | Yes |
| Top N Servers by CPU, Memory and Disk Utilisation reports | Yes | Yes |
| Top N Servers by Interface traffic report | Yes | Yes |
| Health Report for Servers, Routers, Switches etc | Yes | Yes |
| Top N report for routers by CPU and Memory Utilisation | Yes | No |
| Interface Traffic/Utilisation/ Error Reports | Yes | Yes |
| Peak time reports | Yes | Yes |
| WAN Link availability/ RTT report | Yes | Yes |
| Bandwidth capacity planning reports | Yes | Yes |
| Traffic reports | Yes | Yes |
| Schedule Reports | Yes | Yes |
| Custom Reports | Yes | Yes |
| Export Reports (PDF, XLS, CSV formats) | Yes | Yes |
| Email/print report | Yes | Yes |
| Functionality | Motadata AIOps | Solarwinds NPM |
|---|---|---|
| Provision to Create Separate User Accounts | Yes | Yes |
| Role-based user management | Yes | Yes |
| Quick Configuration Wizard (To perform configuration tasks on multiple devices) | Yes | No |
| List View for quickly pushing configurations | Yes | Yes |
| Fully functional web client | Yes | Yes |
| LDAP based authentication | Yes | Yes |
| Functionality | Motadata AIOps | Solarwinds NPM |
|---|---|---|
| API based integration with the existing IT management ecosystem | Yes | No |
| Help Desk Integration | Yes | Yes |
| Failover – Hot standby engine | Yes | Yes |
| 24×5 email and phone support | Yes | Yes |
| Functionality | Motadata AIOps | Solarwinds NPM |
|---|---|---|
| 30-day trial | Yes | Available |
| Support for distributed network | Yes | Limited. Requires EOC to view data across sites. |
| Licensing- based on | No. Of Devices/Instances monitored | Element, which is either a node, interface or volume. |
Break the Barriers to Growth: * Discover how Enterprise Service Management (ESM) helps SMEs cut costs, save time, and reduce compliance headaches. *